
Reading mobile app performance traces like a human 🧠
Building a baseline analyzer for Perfetto


Mobile app performance traces are incredibly powerful —
and almost completely unreadable in raw form.
They contain everything: scheduling decisions, rendering stalls, I/O waits, framework churn.
But none of it comes with labels, ownership, or explanations.
That’s why a real question exists:
How do experienced engineers actually read a mobile app performance trace?
Not by scanning thousands of events line by line.
Not by memorizing Perfetto internals.
But by mentally layering context — what matters, who owns it, and when it matters — on top of the raw data.
This post documents Part 1 of a longer project:
Building a deterministic performance analyzer for mobile app traces, with an optional LLM narration layer on top of Android Perfetto
Part 1 focuses on the first prerequisite:
making raw traces legible enough to reason about at all.
Context: what is Perfetto? 🧩
Perfetto is a system-wide tracing and performance analysis platform developed at Google.
It records time-based events across the entire system—CPU scheduling, threads, frames, I/O, and app-defined markers—and places them on a unified timeline.
Perfetto is used across Linux, Chromium, and embedded systems, but it is most commonly associated with Android, where it powers deep mobile app performance tracing, including:
app startup
UI thread execution
frame rendering (doFrame)
Binder calls
garbage collection
kernel scheduling
All in one trace.
The tradeoff is that mobile app performance traces captured via Perfetto are dense and overwhelming.
They are powerful, but not designed for direct human consumption.
That gap—between raw performance traces and how engineers actually reason about mobile app performance—is exactly what this project is trying to close.
Why this matters ⚙️
Mobile app performance traces contain everything:
CPU scheduling, threads, frames, binder calls, GC, app markers.
But when an engineer opens a trace, they don’t analyze everything.
They scan.
They look for:
obvious long tasks
startup boundaries
frame drops
suspicious main-thread work
In other words, humans apply a mental summary layer before any deep dive.
If I want to reason about mobile app performance, the first step is — making performance traces legible.
How humans read mobile app performance traces 👀
In practice, the first questions are usually:
How long is this trace?
Which app process am I looking at?
Did startup take unusually long?
Are there obvious long tasks on the UI thread?
Do frames look healthy or janky?
This first pass is:
fast
heuristic-driven
approximate
That’s exactly what I wanted to automate first.
What I built (Part 1) 🛠️
I built a minimal Python CLI that reads a mobile app performance trace captured with Perfetto and produces a
structured JSON summary.
No ML.
No dashboards.
Just a baseline analyzer that extracts human-meaningful signals from mobile performance traces.
CLI usage
python -m perfetto_agent.cli analyze \
--trace tracetoy_trace.perfetto-trace \
--out analysis.json
The output artifact: analysis.json 📄
Here’s the shape of the output:
{
“trace_path”: “tracetoy_trace.perfetto-trace”,
“trace_duration_ms”: 5123.7,
“processes”: [
{ “process_name”: “com.example.tracetoy”, “pid”: 23451 }
],
“startup_ms”: 1864.2,
“ui_thread_long_tasks”: {
“threshold_ms”: 50,
“count”: 304,
“top”: [
{ “name”: “<internal slice>”, “dur_ms”: 16572.1 }
]
},
“frame_summary”: {
“total”: 412,
“janky”: 29
},
“assumptions”: {
“startup”: “best-effort heuristic based on first frame”,
“long_tasks”: “slice duration thresholding; attribution refined later”,
“frames”: “doFrame slices; coarse jank signal”
}
}
A small but important observation:
Some long tasks show up with numeric identifiers rather than names.
This is a reminder that raw mobile app performance traces are not designed for humans —
structure and attribution matter.
Those numeric identifiers often come from internal or kernel-level slices.
At this stage, the analyzer reports them honestly rather than pretending to understand them.
This JSON is intentionally:
incomplete
explicit about uncertainty
stable in shape
That last point matters — future AI layers depend on stable structure.
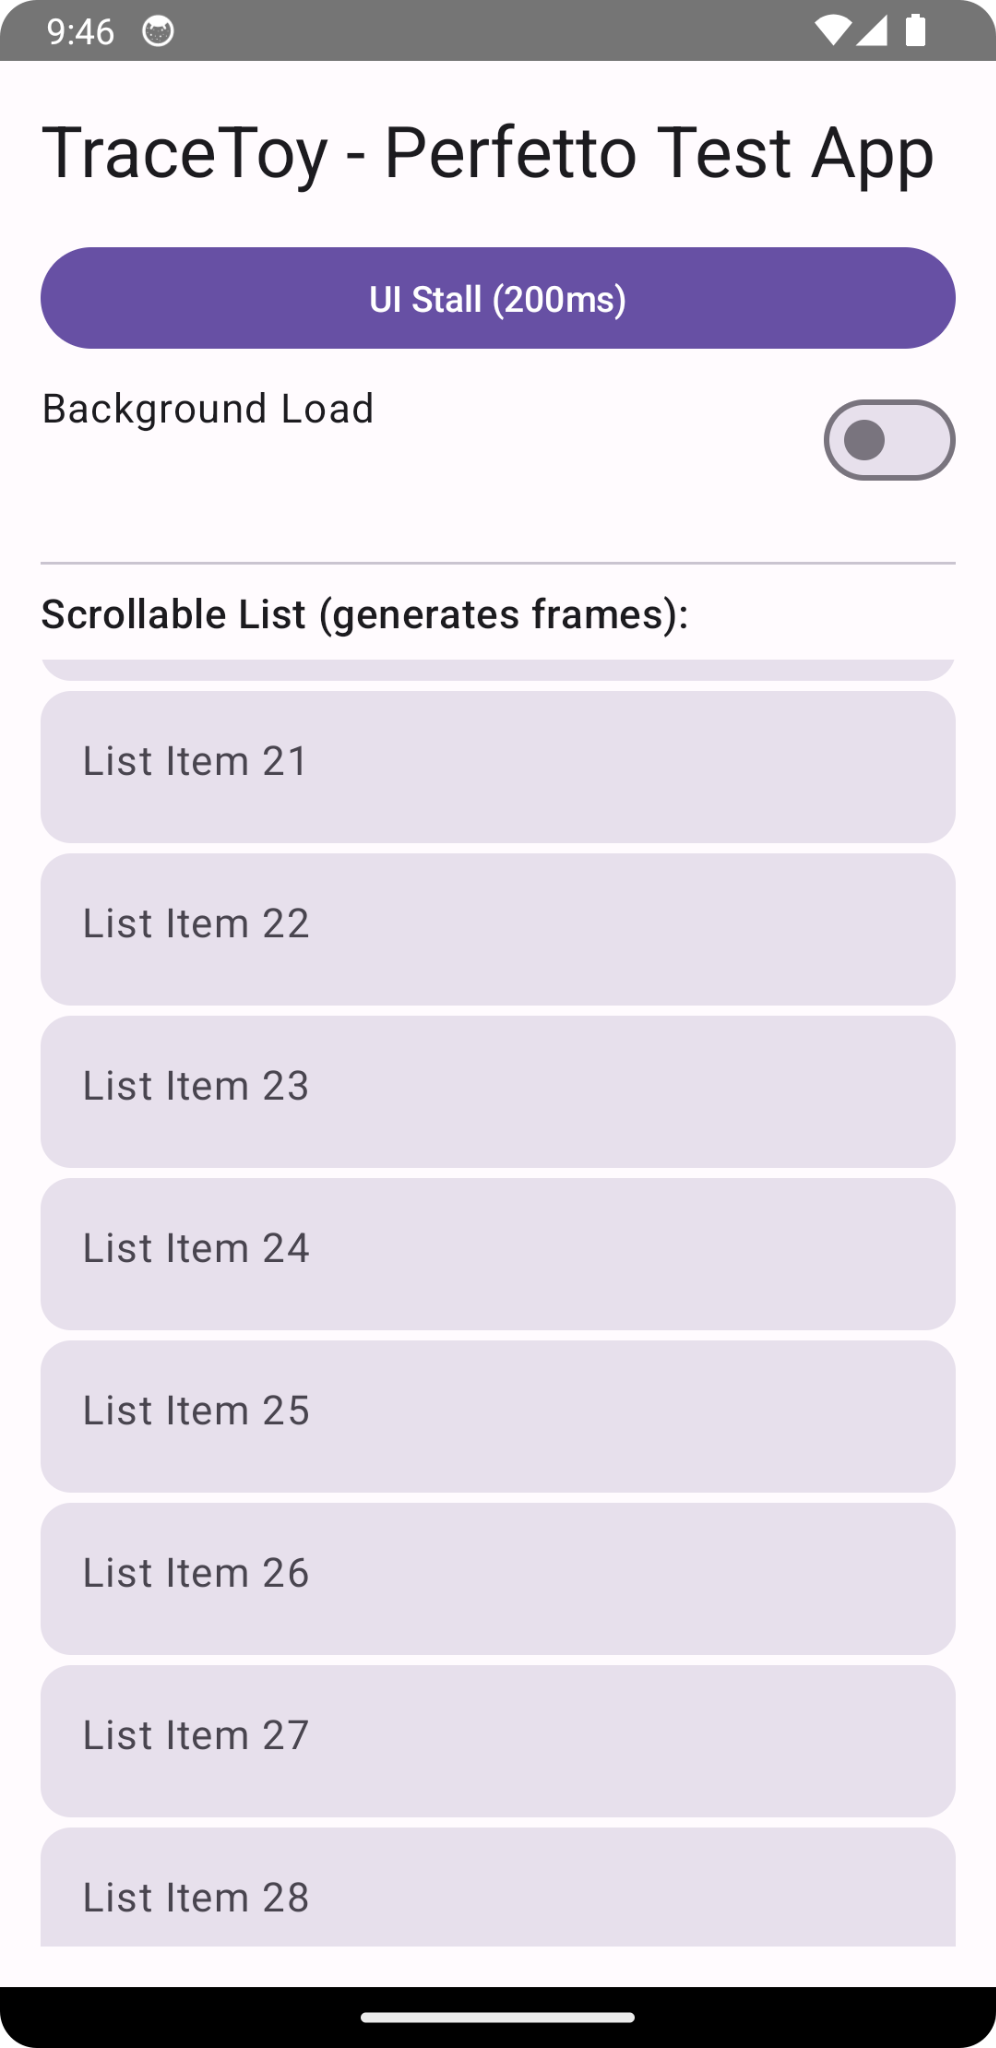
Generating traces: the TraceToy app 📱
To make iteration easy, I built a tiny Jetpack Compose test app that intentionally creates recognizable mobile app performance signals:
simulated startup work
a button that deliberately stalls the UI thread
optional background CPU load
a scrolling list to generate frames
explicit Trace.beginSection / endSection markers
This makes mobile app performance traces predictable and interpretable, which is essential when building analysis tools.
Assumptions and limitations (by design) ⚠️
This analyzer is intentionally rough.
Startup time is a best-effort heuristic
Main-thread attribution is incomplete
Frame jank is coarse
All of this is documented explicitly in the output.
At this stage, correctness matters less than:
not crashing
not hallucinating
being explicit about what we don’t know
What’s next 🔜
Next, I’ll move from a summary to a feature schema for mobile app performance traces, including:
better UI-thread attribution
CPU slice aggregation
reusable performance features
Links 🔗
Perfetto analyzer:
https://github.com/singhsume123/perfetto-agentTraceToy test app:
https://github.com/singhsume123?tab=repositories
Closing thought 💭
Before teaching machines to reason about mobile app performance,
we need to be honest about how humans actually read performance traces:
quickly, heuristically, and with imperfect information.
This post is the first brick in that foundation